| Canadian TB Fluoroscopy Study: How the Data Are ‘Linearized’ to Support the LNT | |||||||||
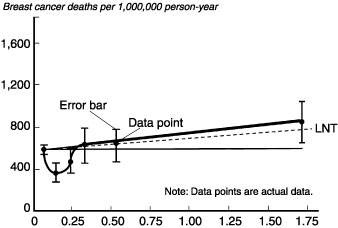
| The dots show the actual breast cancer data for each dose group in the Miller et al. 1989 study. Although there is reduced breast cancer for the low-dose groups (lower left of graph), the paper by Miller et al. nevertheless reports that the dose response is linear, represented by the straight line from the high dose range to zero, far outside the error bars of the actual data.
The paper states that a dose of 1 centi-gray would produce 60 excess cancers in 1 million women. The data point at 15 centi-gray, however, represents a reduction of 10,000 cancers in 1 million women actually exposed, compared with the linear conclusion that 900 excess cancers would be expected. In the later report by Howe and McLaughlin (1996), the data are reported as a single dose group from 1 to 49 centi-gray, in order to obfuscate the reality. Source: Adapted from Miller et al., 1989 |
 |
||||||||
|
|||||||||